Introduction
C is the best language. It has functions, variables, the volatile
keyword, what’s there not to love?
Well, its error messages, apparently.
Have you ever worked on a big project filled with state machines and
pointer arithmetic through the wazoo, compiled it successfully with no
warnings, only to run it and see Segmentation fault (core dumped)?
This sucks, because it gives you no information on why it failed, or
what you should do to fix it. When you see this error, it means that
it’s debugging time.
Assuming you don’t use an IDE (in that case, use its included debugger), here are the tools you’ll need:
- The Gnu Debugger (GDB)
- A C compiler (e.g. GCC)
- A text editor (e.g. Nano)
They’re all incredibly common pieces of software, and assuming you’re on Linux, all of these tools (including your OS) have “GNU” in the name. So it shouldn’t be too hard to get a hold of them using your distro’s package manager.
If you’re on Windows, you should be using Visual Studio and its debugging tools.
Note: This article assumes that you’re familiar with using a shell, and editing text.
What is GDB
GDB is a tool to analyze your code. With it, you can know the value of any variable in your program at any time, what functions call which in what order, which tests pass and which don’t, how many times a loop loops, etc.
Chances are, you wanted that information at some point, and you
peppered printf statements all around your code. You knew there was
a better option, but you didn’t want to bother with figuring it
out. Maybe You maybe heard of GDB, but when you ran the command, you
were greeted by a scary shell and you thought “to hell with this!”
It’s not as scary as it seems. Here is how you setup GDB with a live view of your code.
Compiling
Let’s take this piece of code as an example:
|
|
Before running GDB, you need to compile your binary with debug
symbols. The debugger needs those to read your binary’s code. Compile
your program with the -g flag on either GCC or Clang like so: gcc -g debug.c -o debug.
Now, let’s debug!
Entering the Debugger
Entering the debugger is pretty straight-forward: gdb --ex "layout src" ./debug.
The option --ex "layout src" is entirely optional, it’s just there
to grant you a window to view your source code and where the execution
is at. If you don’t want to write this line at every invocation, enter
the command echo "layout src" >> $HOME/.config/gdb/gdbinit.
Breakpoints
Debugging is done by analyzing the state of the program, but which state? Since the program can potentially change state at every line, you must specify points at which the program will pause so that you can analyze it. Those points are called breakpoints.
You will use breakpoints in conjunction with almost every other debugging commands in GDB, but by they can still be useful by themselves. They can show you where your code reaches. Not sure if a certain function is called, or if your code goes into the if or the else? You only need one breakpoint to find out.
In GDB, the command is intuitively named break. You can set
breakpoints at specific lines of functions or files. For functions,
specifying a line is optional, and will default to the first line of
the function.
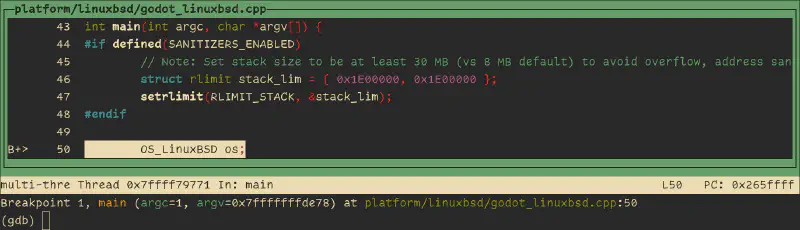
Let’s break at the main function of our program with the command
break main. You should see a b+ left of line 10.
Running
Once your breakpoints are set, you can run your program with the
command run. If you want to give your program arguments (in the case
of our program, it receives none), give them as arguments to the run
command.
Enter the run command, and your program should stop at the breakpoint you’ve set if you’ve done everything correctly.
Keep in mind that you can restart the program at any point! If you
went too far, if you want to test something that happened earlier, or
if you want to try different arguments, just use the run command
again.
Next Line
We can stop the program anywhere we want, great! But how do we move around? Here are the most important commands:
nextto the next line. It does not enter functions, but it does loop around for, do and while loops.stepis likenext, but it enters functions.upis likenext, but it skips loops.continueto resume your code’s execution as normal until it hits another breakpoint.returnto return from the current function.
Now try it out by entering the next command, your cursor should be
at line 11. Don’t hesitate to mess around with the movement a bit, and
just use the run command if something unexpected happened.
You’ll probably want to go to the next line pretty often, and entering
“next” 50 times isn’t fun. In that case, you can either enter a
shortcut for the command (n, s, u, c and ret respectively), or
enter an empty line, which will run the previous command.
Note: Almost all commands have shortcuts, you can learn them with
help <command>.
Note: While moving around and printing information (more on that next chapter), you may get your terminal to look weird and corrupt. That’s just a display bug. To fix it, redraw your screen with the shortcut
Ctrl-L.
Reading Variables
This one is pretty straight-forward, use print command to print the
value of any variable (or function!).
Try it out with print i, 20 should print out. Mind blown.
Another method is to use the extremely versatile info command with
the local argument for local variables, and args for function
arguments.
The print and info commands are very powerful and
configurable. You can print data as any data type, configure how you
want your structures and arrays to be printed, retreive information on
your cache, threads, OS, scopes, etc.
Be sure to read the resources in Learn More once you feel comfortable with the debugger.
And with that, we’ve nearly completely eliminated the need to test with printf() statements.
Frame Stack
You now know enough to debug effectively, everything listed above is 70% of what you’re going to use. But there is one last thing I’d like to touch on: the frame stack.
The frame stack is the path the program took to get a to a certain
function call. If function main() calls function game_loop(), which
calls function move_player(), and a breakpoint is reached in that
latter function and the frame stack is printed with the backtrace
command, then the frame stack will look like this:
|
|
This can be very useful to know. If your function doesn’t work as expected, but only sometimes, then it may have something to do with the functions that were called before it. The frame stack can also be used to capture hard-to-find recursion bugs.
It’s also possible to move from frame to frame with the frame
command. In the example above, the debugger is currently at
frame 0. If you want to see what’s going on in the main() function
at this point in time, use the frame 2 to jump to the last
frame. From there, you can see where game_loop() is called, and
what’s the value of the current variables.
Learn More
GDB is an enormous and powerful program, I highly recommend learning how to best utilize it. The documentation is excellent, both internal and external.
You can learn more about any command in GDB with the help command, and you can read the user manual here.